Detecting Green Rooftops in Rotterdam
This is the first in a series of two posts on my early work applying machine learning approaches to public policy problems. You can also read the second post or a pdf version complete with citations. Each of the posts goes over a separate project. On this first one, I’ll explain how my team and I developed a tool for the detection of green rooftops in Rotterdam, and why.
In the city of Rotterdam, pressure on public space is high due to the population density and the extensive built environment. As a city that is 90% below sea level, a major problem it faces is the threat of floods and storm surges. In the context of storm water management, green rooftops can play a major role in reducing the pressure on Rotterdam’s combined sewer system, since this kind of roofing has the unique capability of retaining precipitation, decreasing the speed of rainwater runoff, and limiting peak discharges.
The 14 km2 of flat roofs in the city of Rotterdam have an untapped potential as a multi-use and sustainable extension of the public space at ground level, and offer space for the city to address its urban planning challenges. Since the municipality decided to subsidize the conversion of normal flat roofs into green rooftops, it was essential to have a tool to verify their existence and monitoring their upkeep.
We partnered with the Municipality of Rotterdam to increase the use of evidence-based urban planning, specifically for storm water management, by developing a scalable tool that identifies green roofs.
Data
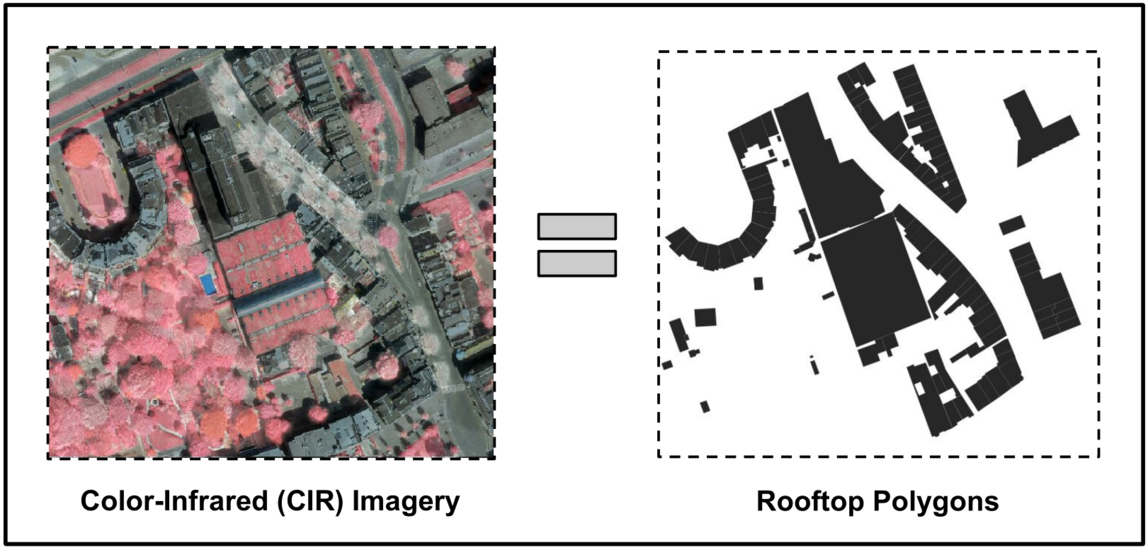
Being developed with the support of the municipality, this project had access to proprietary, governmental data. This included high-definition Color-Infrared (CIR) aerial imagery of an area of interest in Rotterdam, and a file containing polygons outlining each building in the same area. CIR images contain the traditional RGB bands of color images, and an additional band on the near-infrared spectre. The polygons are part of the national building database of the Netherlands, and are normally collected at time of construction. They can be used as a proxy for the outline of each rooftop, and contain additional information such as the year of construction and type of building.
Approach
The initial step of our approach was to use the CIR imagery to obtain the Normalized Difference Vegetation Index for the whole area of interest, as shown in following formula, where RED and NIR correspond to red and near-infrared bands in the CIR imagery (they’re matrices).
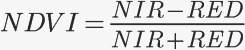
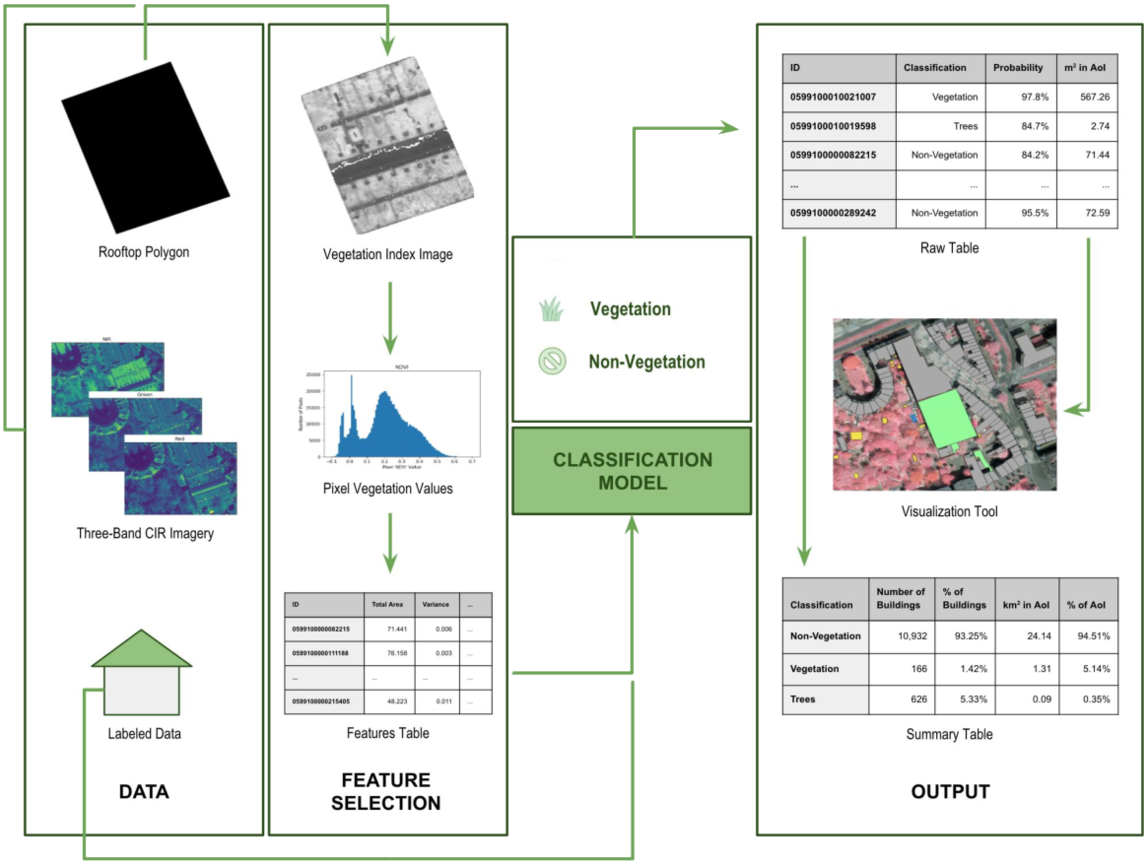
The NDVI is a simple graphical indicator often used to analyze remote sensing measurements for the existence of live green vegetation. By performing this operation between the near-infrared and the red bands, we obtain an NDVI band, which gives us a gradient of the lushness of the vegetation in the area of interest. By cropping this band in order to consider only the area inside the building polygons, we obtain information about the density of vegetation in each rooftop. Using the NDVI band, descriptive features for the degree of vegetation in each rooftop were designed, in order to train a binary classification model. This model was trained on manually-labeled data, consisting of polygons of some green rooftops known by the municipality and a number of regular rooftops. Our labeled data was unbalanced 10 to 1, in a total of 440 labeled rooftops. We tested the fit of the different models for our classification model. The selected approach was Logistic Regression, chosen for its combination of simplicity and performance. In addition to the classification for each rooftop, our tool also creates a visualization of the area of interest, outlining the vegetated rooftops.
Results
The approach achieved a 90% precision and 80% recall in a sample of our labeled data used as validation set. It quickly detected other vegetated rooftops across the city, and the provided insights made the tool useful for assistance in public policy. The tool can also provide a quick overview of the city’s rooftops with both number of vegetated roofs and their total relative area.
Were this project developed today, I would start by experimenting with Deep Learning approaches, which have since become the standard in most computer vision taks. The vegetated rooftops have a specific kind of vegetation, similar to moss, and our model would occasionally wrongly flag normal rooftops with tree canopies overlaying, mostly because of inaccuracies in the GPS coordinates of the polygons. All the experimented approaches struggled with this phenomenon. Given that development of the tool was continued after our proof-of-concept by a team hired by the municipality, it is fair to assume that later iterations include such models as part of the pipeline.
Our initial version of the tool was open sourced under a permissive license, and is avaliable on Github.
Conclusion
Despite its proof-of-concept status, this projects had a significant impact for the Municipaliy of Rotterdam. This is due to the fact that it provides a quick and easy to monitor description of the rooftop landscape in the city, and can also track its evolution.
It was interesting to note that, despite the simplicity of the models, their performance was enough to make them very useful in assisting public policy. This is partly due to the fact that the features being detected in the images are striking relatively to the rest of the environment, which makes them particularly suitable to this kind of approach.
This work was my introduction to the area of machine learning, which has since become my area of occupation. With this project, I became deeply aware of the power of these techniques when applied to the right problem, and the transformative power they can have in society.
Note: This project was developed in partnership with the Municipality of Rotterdam as part of The University of Chicago Data Science for Social Good Fellowship. Check out the project website.